September 16, 2026
4 Chatbot Performance Metrics That Prove ROI to the Board
Use four metrics: containment, CSAT, fallback, and cost per resolution to map chatbot performance to dollars with a board ready playbook.

4 Chatbot Performance Metrics That Prove ROI to the Board
Four metrics decide whether your chatbot earns its keep: containment rate, customer satisfaction (CSAT), fallback rate, and cost per resolution. Watch CSAT and fallback rate together, weekly, as your leading pair. Review containment and cost per resolution monthly against business outcomes. Everything else in your dashboard supports these five, not the other way around.
TL;DR:
- Monitoring CSAT and fallback rate weekly helps detect issues early before customer satisfaction declines significantly.
- Containment rate should be strictly designed, with positive success signals guiding conversation resolution rather than simple absence of escalation.
- Strive for a fallback rate below 20% daily and keep track of hallucination rates, especially in regulated industries, with thresholds around 2 to 3 percent.
- Conduct weekly, stratified sampling of conversations and review intent and response accuracy to identify and fix knowledge gaps and hallucinations promptly.
- Use a unified, multi-channel telemetry platform that provides consistent metrics across web, mobile, and social channels to identify performance discrepancies.
Table of Contents
- What are the main categories of chatbot performance metrics?
- Core chatbot performance metrics: formulas and benchmarks
- How do you measure chatbot response quality and hallucinations?
- Setting up dashboards and alerts that catch problems early
- How do you read chatbot metric pairs to find root causes?
- Turning chatbot metrics into dollars for the board
- The analytics feedback loop practitioners actually use
- User engagement metrics: session length, turns and drop-off
- Sentiment analysis and emotional response metrics
- Intent recognition and entity accuracy: the metrics behind the metrics
- Multichannel performance: why web, mobile and social differ
- What executives should insist on
- How Agentrelease supports the measurement loop
- Sources
- FAQ
What are the main categories of chatbot performance metrics?
Every metric you could track falls into one of four buckets, and confusing them is why so many teams report “great numbers” while customers stay frustrated. Efficiency metrics tell you how much human effort the bot is saving. Quality metrics tell you whether it’s actually right. Knowledge health metrics tell you whether the bot has the information it needs. Business impact metrics tell you whether any of this matters to revenue.
Executives tend to fixate on efficiency (it’s the easiest to report) while ignoring quality, which is exactly backwards.
- Efficiency metrics — containment rate, deflection rate, average handling time. Use these to justify headcount decisions and channel investment.
- Quality metrics — CSAT, fallback rate, hallucination rate, first contact resolution. Use these to catch problems before they show up in churn.
- Knowledge health metrics — no-match topics, stale content flags, retrieval accuracy in RAG systems. Use these to guide content and knowledge base updates.
- Business impact metrics — cost per resolution, revenue attributed, payback period. Use these in board reporting.
For support-heavy deployments, weight quality and knowledge health above raw containment. For lead generation and sales bots, weight business impact and conversion-adjacent engagement metrics higher, since a bot that “contains” a sales conversation without booking a demo hasn’t achieved much of anything.
Core chatbot performance metrics: formulas and benchmarks
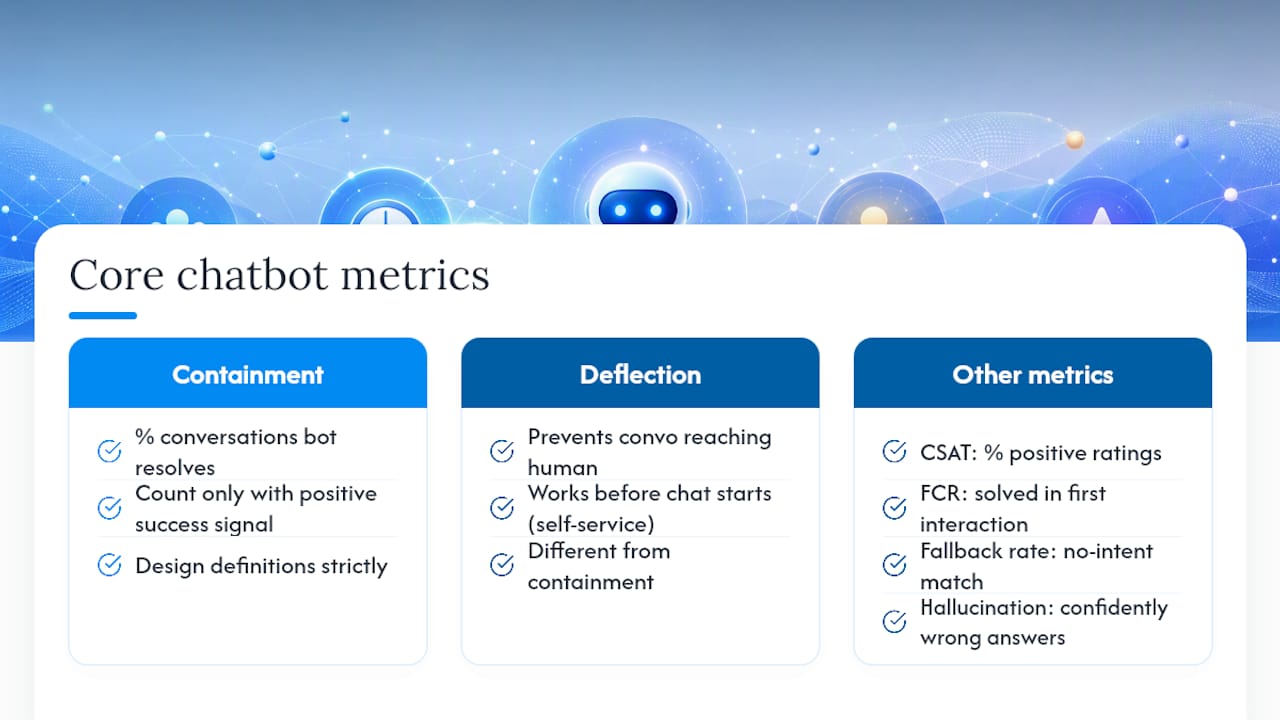
Containment rate is the percentage of conversations the bot resolves without human handoff: (conversations handled fully by bot ÷ total conversations) × 100. It’s often confused with deflection rate, which measures conversations prevented from ever reaching a human channel, typically via self-service prompts before a chat even starts. Containment measures what happens inside the conversation; deflection measures what happens before it. Design containment strictly. Count a conversation as contained only when there’s a positive success signal, like a completed booking or explicit user confirmation, rather than simply the absence of escalation. Loose definitions inflate containment numbers and hide real failure.
CSAT is usually captured through a post-chat thumbs up/down or a 1 to 5 scale prompt, then expressed as the percentage of positive responses out of total ratings.
First contact resolution (FCR) measures whether an issue was solved in the first interaction, human or bot, without follow-up. It differs from containment because a conversation can be contained (no human handoff) yet still fail FCR if the user comes back with the same issue two days later. Tracking both together exposes the gap between “the bot said something” and “the bot actually fixed it.”
Fallback rate, also called no-match rate, tracks conversations where the bot couldn’t map user intent to a known response. Hallucination rate is narrower: it measures confidently wrong answers, not just missed ones, and requires human-reviewed sampling to catch reliably, as peer-reviewed evaluation research on conversational AI confirms. A practical sampling approach is reviewing 100 to 200 conversations weekly, stratified across your top intents.
These ranges vary heavily by industry and use case complexity, so use them as a starting compass, not a target to game.
How do you measure chatbot response quality and hallucinations?
Quality measurement lives or dies on sampling discipline. A random weekly pull of conversations tells you almost nothing useful because your rarest, riskiest intents get under sampled by definition. Stratified sampling fixes this: pull a fixed number of conversations from each major intent category, plus a dedicated pool of edge cases and previously flagged failures.
- Export a weekly sample. Pull 100 to 200 conversations, stratified by intent, with extra weight on new or recently changed knowledge base articles.
- Label with a simple taxonomy. Mark each bot response as correct, partial, or hallucinated. Partial means factually right but incomplete or poorly worded.
- Choose your labelling method. Human review is the gold standard for accuracy, but LLM-assisted labelling can pre-sort the bulk of “clearly correct” responses so reviewers spend their time on the ambiguous ones. PMC’s evaluation research backs human annotation as necessary for reliable hallucination measurement, particularly on edge cases automated scoring tends to miss.
- Trace RAG retrieval sources. For retrieval-augmented systems, check whether the retrieved passage actually supports the answer given. A mismatch here, even with a fluent response, counts as a hallucination. Adjusting retrieval depth (top-K) is a known lever for this trade-off, as the concept is documented in retrieval-augmented generation literature.
- Compute your hallucination rate. Hallucinated responses ÷ total sampled responses × 100. Set your alert threshold based on your risk tolerance. Regulated industries should flag anything above 2 to 3%.
Pro Tip: Keep a running “hallucination log” of flagged responses with the source article they contradicted. It becomes your prioritised knowledge base fix list without any extra analysis work.
Setting up dashboards and alerts that catch problems early
A dashboard that only shows lagging indicators tells you about damage after it’s done. Structure yours in four rows: an executive row (CSAT, containment, cost per resolution, conversation volume), a performance health row (fallback rate, hallucination rate, FCR), an operations row (response latency, uptime, queue depth for escalations), and a trends/anomalies row that plots week-over-week deltas rather than raw numbers.
Fallback rate is your best leading indicator. It moves before CSAT does, because users experience a bad answer for days before they bother leaving a poor rating. Monitoring guides that pair CSAT with fallback rate as headline metrics exist precisely because fallback catches regressions early enough to act on.
Practical alert thresholds worth setting:
- CSAT drops more than 5 points below its 30-day rolling average.
- Fallback rate spikes above 20% in any single day, or trends upward for three consecutive days.
- Containment rate drops more than 10% week over week without a corresponding traffic mix change.
- Response latency exceeds 3 seconds for more than 5% of conversations in an hour.
A quiet but telling signal: a rising fallback rate paired with flat containment often means users are rephrasing the same failed question multiple times before giving up, an outcome your containment metric won’t flag but your fallback trend will.
Tool categories worth evaluating include conversation analytics platforms for intent and sentiment extraction, evaluation pipelines for automated regression testing, and general observability tools adapted for conversational logs. IBM’s overview of conversational analytics describes how these platforms turn raw interaction data into the kind of actionable signal a dashboard alone can’t surface.
How do you read chatbot metric pairs to find root causes?
Single metrics lie by omission. Pairs tell the truth, because they expose the gap between “the bot did something” and “the bot did the right thing.”
- High containment, low CSAT. The bot is closing conversations without a human handoff, but users aren’t happy with the outcome. Audit resolution quality and conversation UX friction, not volume.
- Fallback spike with a containment drop. Something broke, often a knowledge base change or a new user intent nobody trained for. Export the fallback conversation topics, cluster them by theme, and ship fixes for your top 10 recurring gaps first.
- Rising escalation rate. This isn’t automatically bad. A sensible escalation rate for genuinely complex issues is healthy, not a failure signal. Tag escalation reasons (complexity, user preference, policy exception) so you can separate “the bot correctly punted” from “the bot gave up too early.”
- FCR falling while containment holds steady. Users are coming back with the same issue. The bot is technically closing the loop but not solving the problem underneath it.
Prioritise fixes by impact multiplied by effort, not by whichever complaint arrived most recently. A knowledge base update fixing a top-five fallback topic usually beats a model retrain for effort invested. Schedule a follow-up measurement two weeks after any fix ships. Anything less and you’re guessing at causation.
Turning chatbot metrics into dollars for the board
Cost per resolution is the number that gets executive attention: (total platform and staffing cost ÷ resolutions handled by the bot). Compare that against your average human agent cost per resolution, which typically includes wages, overhead, and average handle time. The delta is your savings case, and it’s far more persuasive in a board meeting than a containment percentage on its own.
A monthly executive summary should stay short and hit five points every time:
- Cost impact — cost per resolution this month versus last, and versus human agent baseline.
- CSAT and containment — current figures against your 90-day trend line.
- Top fixes shipped — what knowledge base or flow changes went live and why.
- Fallback and hallucination trend — direction of travel, not just a snapshot.
- Next steps — the two or three highest-priority items for the coming month.
Payback period calculation is straightforward: platform and implementation cost ÷ monthly savings from deflected human-agent volume. Run sensitivity scenarios at conservative, expected, and optimistic containment rates, since a five-point swing in containment can shift payback by months.
Revenue attribution is trickier and depends on your setup. If your platform supports server-side revenue tracking, tie specific bot conversations to completed purchases or bookings rather than relying on self-reported conversion estimates, which tend to run optimistic. Adoption of conversational AI as a primary customer service channel is expected to keep accelerating, which makes getting this attribution model right now, rather than retrofitting it later, worth the upfront effort.
The analytics feedback loop practitioners actually use
Measurement without a loop back into the product is just reporting. The loop that works has four steps, repeated on a fixed cadence rather than whenever someone remembers.
- Measure weekly. Export fallback logs, CSAT scores, and your stratified quality sample every week without exception.
- Diagnose within 48 hours. Cluster fallback topics by theme and rank them by frequency times business impact.
- Update within the sprint. Ship knowledge base fixes for your top 10 identified gaps, and queue model or prompt changes for anything that needs deeper work.
- Validate before closing the loop. Re-run your evaluation sample against the updated knowledge base or model, ideally using a reproducible workflow. LangChain’s evaluation documentation lays out a template for building golden datasets and running repeatable tests, which turns “we think it’s better” into something you can actually confirm.
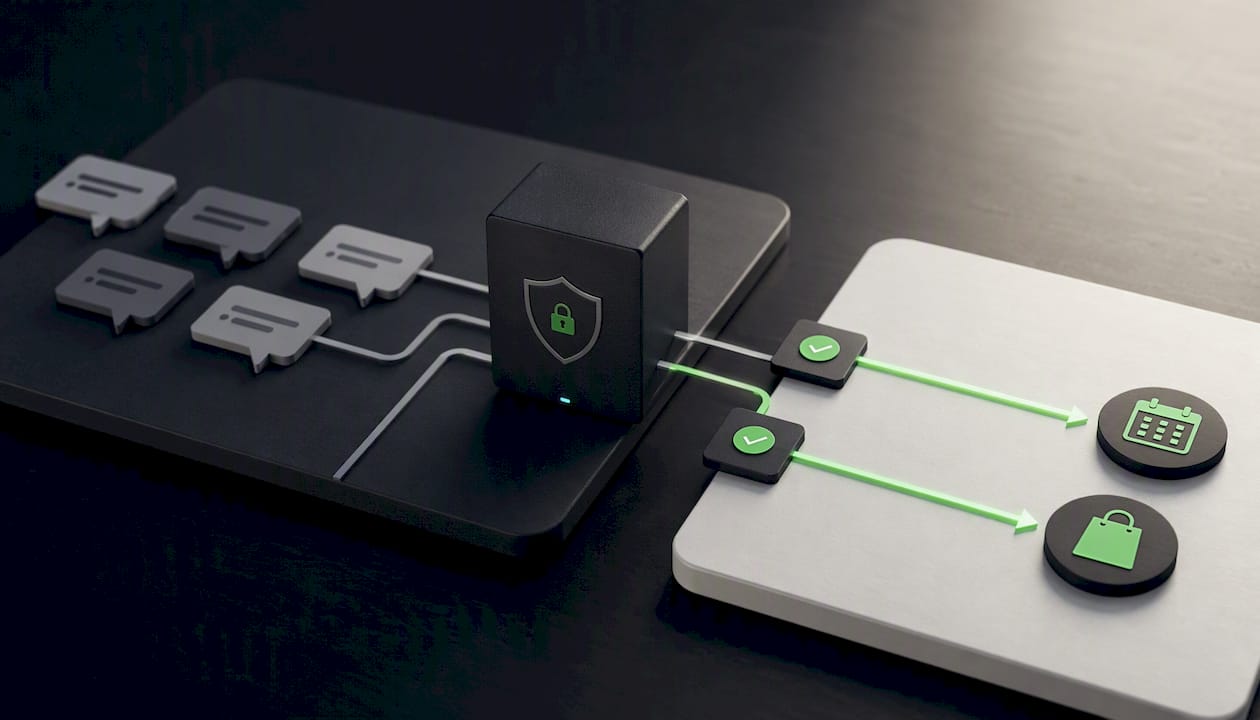
A white-label platform built for multi-tenant, multi-channel deployment shortens this loop considerably. An approach to multi-channel telemetry means fallback and containment data across channels land in one place rather than multiple disconnected exports, and server-side revenue attribution removes the guesswork from step four’s validation. Fast deployment means the gap between diagnosing a problem and testing the fix stays short enough that the loop actually gets run weekly instead of quarterly.
Pro Tip: Assign one named owner to the diagnose step. Loops die not from lack of data but from nobody being accountable for turning fallback logs into a prioritised fix list.
User engagement metrics: session length, turns and drop-off
Engagement metrics tell you whether users are sticking around long enough to get value, or bailing before the bot can help. Average session length matters less in isolation than in context: a long session on a support bot might mean thorough troubleshooting, or it might mean the user is stuck in a loop.
Conversation turns, the back-and-forth exchanges within a single session, are a better diagnostic. Very short sessions (one or two turns) often mean the bot answered correctly and fast, which is good, or that the user gave up immediately, which is bad. You can only tell the difference by pairing turn count with your outcome signal, whether that’s containment, CSAT, or a completed action.
Drop-off rate, the percentage of conversations abandoned mid-flow before resolution, is one of the most underused engagement metrics available. Track where in the conversation drop-offs cluster. A spike right after a specific question (asking for an order number, say) usually points to friction in that exact step rather than a broader bot quality problem.
Benchmark these against your own historical baseline rather than industry averages, since acceptable turn counts vary enormously between a quick FAQ bot and a multi-step booking flow. What you’re really watching for is a shift: turns creeping up over time on the same intent category usually means the bot is struggling more than it used to, even if containment hasn’t moved yet.
Sentiment analysis and emotional response metrics
Sentiment scoring adds a layer CSAT surveys miss entirely, because most users never fill out a rating. Sentiment analysis applied to the conversation text itself, typically scored as positive, neutral, or negative, gives you a read on emotional tone across effectively 100% of conversations rather than the small slice that responds to a post-chat prompt.
This matters most for catching frustration before it escalates. A user who never rates the conversation but types increasingly short, terse messages is showing a signal your CSAT number will never capture. Conversational analytics platforms built for this purpose extract sentiment and intent simultaneously, which is part of why IBM’s conversational analytics frameworks pair the two rather than treating them as separate workstreams.
Track sentiment trend lines by intent category, not just overall. A single intent trending negative while your average holds steady is exactly the kind of problem an aggregate score buries. Escalating sentiment shifts, where a conversation starts neutral and ends negative, deserve their own tag, since that pattern often points to a bot that misunderstood context partway through rather than one that failed from the first message.
Be cautious about over indexing on sentiment as a standalone KPI. It’s a diagnostic signal, not a business outcome. Pair it with containment or resolution data before drawing conclusions, the same way you’d pair fallback rate with containment rather than reading either alone.
Intent recognition and entity accuracy: the metrics behind the metrics
Every downstream metric, containment, CSAT, fallback, depends on one upstream capability: whether the bot correctly identified what the user wanted in the first place. Intent classification accuracy measures the percentage of messages correctly mapped to their intended category, calculated by comparing the bot’s classification against human-labelled ground truth on a test set.
Entity recognition accuracy is the companion metric, measuring whether the bot correctly extracted specific details, an order number, a date, a product name, from the user’s message. A bot can classify intent perfectly (“this is a return request”) and still fail the task if it extracts the wrong order number.
These two metrics matter because they’re leading indicators for fallback rate. A drop in intent classification accuracy on a specific category will show up as rising fallbacks for that category within days. Testing this requires a held-out labelled dataset, ideally refreshed quarterly as language patterns and product terminology shift, run against the model using a reproducible evaluation workflow rather than ad hoc spot checks.
LangChain’s documented evaluation workflow covers exactly this: building a golden dataset, defining metrics, running evaluations, and wiring the results into CI/CD so intent accuracy gets checked automatically before any model or prompt change ships. Teams that skip this step tend to discover accuracy regressions only after fallback rate has already spiked in production, which is the expensive way to find out.
Multichannel performance: why web, mobile and social differ
A chatbot’s performance metrics rarely look identical across channels, and treating them as one blended number hides where the real problems live. Web chat, mobile app messaging, and social platforms like WhatsApp or Instagram DMs each carry different user expectations, message length norms, and technical constraints.
Response latency benchmarks that feel fine on web chat can feel sluggish on SMS or WhatsApp, where users expect the near-instant rhythm of texting a friend. Containment rate often runs higher on structured channels like web widgets, where buttons and quick replies guide the conversation, and lower on open text channels like email, where user phrasing is less predictable and intent recognition works harder.
Track your core metrics, CSAT, fallback rate, containment, per channel rather than only in aggregate. You’d never catch that gap looking at the combined number alone.
Mobile-specific considerations include shorter attention spans and higher drop-off tolerance for slow responses; social DM channels often carry higher expectations for personality and tone matching the platform’s casual register. A platform that runs the same brand voice across iMessage, WhatsApp, Messenger, and web chat under one dashboard makes this per-channel comparison straightforward instead of requiring four separate exports stitched together manually.
What executives should insist on
Most chatbot metric dashboards are built by whoever configured the platform, not by whoever has to defend the budget. That’s backwards. I’d tell any executive to insist on CSAT and fallback rate as the headline pair from day one, because everything else is either an input to those two or a translation of them into dollars.
Assign clear ownership. Someone specific should own the weekly fallback review, and someone specific should own turning that review into knowledge base fixes. Vague accountability is why so many “monitoring dashboards” sit unread.
Balance the easy wins against the harder ones. Knowledge base fixes move fast and show up in next week’s numbers. Model and retrieval improvements take longer but compound. Fund both, on different timelines.
— Agent
How Agentrelease supports the measurement loop
Most of the metrics covered above depend on one thing: getting clean, unified conversation data out of every channel your bot runs on. That’s harder than it sounds when your web chat, WhatsApp, and email agents sit on three different systems with three different export formats.

This platform is designed as a white-label solution for agencies and businesses that need to deploy branded AI agents across multiple messaging and chat channels without stitching together separate tools for each. Because telemetry runs through one system regardless of channel, containment and fallback tracking stay consistent rather than requiring multiple measurement approaches. Server-side revenue attribution means the business impact translation covered earlier doesn’t rely on self-reported estimates. Deployment is fast, which matters when your feedback loop depends on shipping knowledge base fixes quickly rather than waiting on a lengthy build. An unlimited tenant model also means agencies running metrics across multiple client accounts aren’t paying per seat to do it.
If you’re evaluating platforms with measurement in mind, the Agentrelease pricing page lays out the flat monthly structure, and the white-label program details cover the branding and multi-tenant setup for resellers. For a closer look at how channel routing and telemetry work together, the white-label configurator walks through the technical setup directly.
Sources
- What Is Conversational Analytics? | IBM
- Evaluate a chatbot - Docs by LangChain
- PMC — conversational AI evaluation (peer-reviewed article)
FAQ
What is the single most important chatbot metric?
There isn’t one metric that stands alone reliably, but CSAT paired with fallback rate comes closest to a headline pair, since monitoring guides recommend tracking them together specifically because fallback moves before CSAT does.
How often should you sample conversations for quality checks?
Weekly sampling of 100 to 200 conversations, stratified by intent, is the practical standard supported by human evaluation research on conversational AI. Monthly sampling misses drift that compounds into bigger problems by the time you catch it.
How do you measure chatbot hallucination rate?
Calculate it as hallucinated responses divided by total sampled responses, multiplied by 100, using human-reviewed or LLM-assisted labelling against a taxonomy of correct, partial, and hallucinated.
What should a starter chatbot dashboard include?
Start with four rows: an executive row for CSAT, containment, and cost per resolution; a performance health row for fallback and hallucination rate; an operations row for latency and uptime; and a trends row tracking week-over-week deltas rather than static snapshots.
Does Agentrelease provide chatbot analytics?
Agentrelease provides multi-channel telemetry across iMessage, WhatsApp, email, and other channels under one dashboard, along with server-side revenue attribution for tracking business impact. Pricing is listed at $497 per month for the core platform, with white-label details available separately.